
In Universal Analytics (UA), we were able to create reports that contained only certain data. For example, sites with a .ca and .com domain would have a separate CDN View and USD View, and a ALL View (aggregated data from .ca and .com).
GA4 does not have Views. And until recently, you could not easily make a set of reports in GA4 that contained only certain data. Thankfully, Report Filters makes that possible.
I’ll show you how to set up a basic filter on any report. Then how to customize and save reports into a collection in the Library section of GA4.
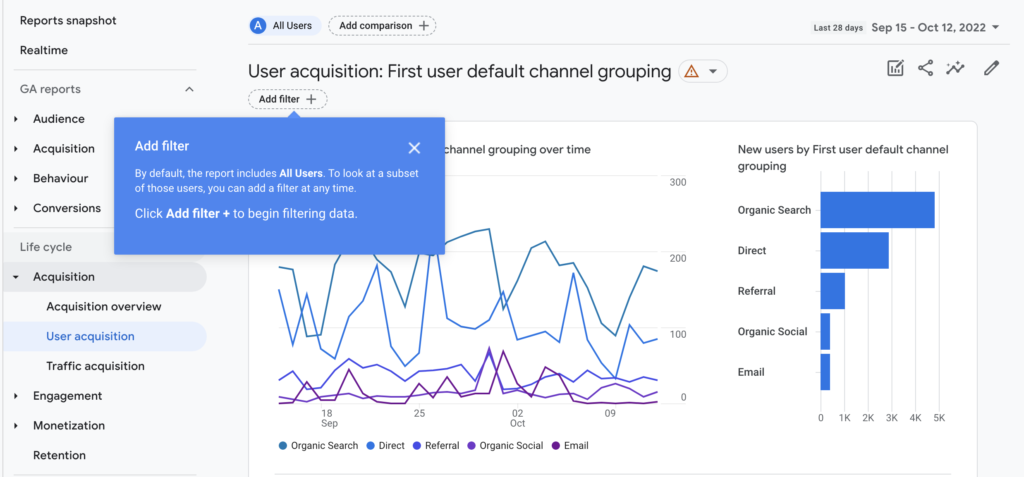
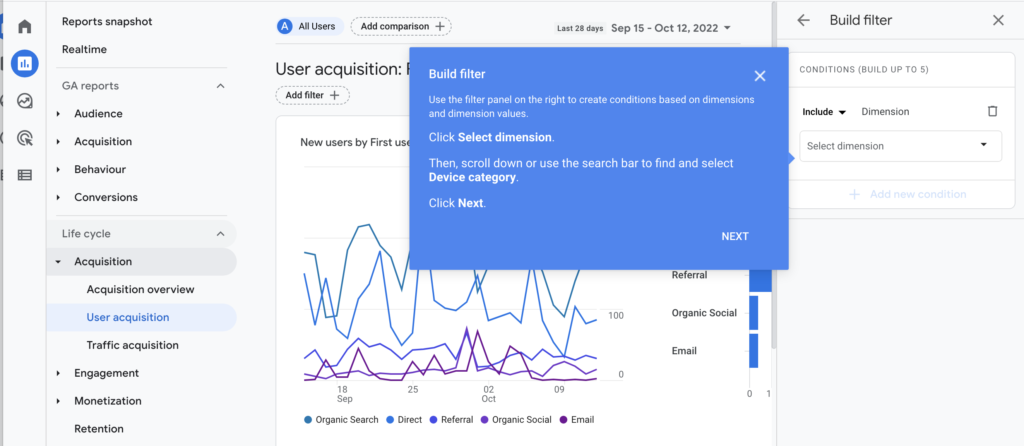
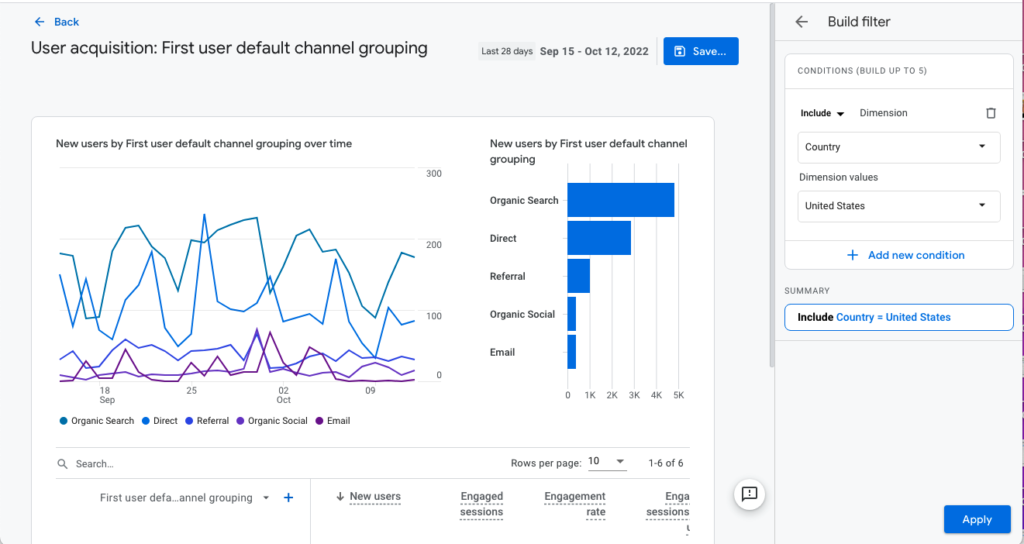
How to set up a basic filter on any report
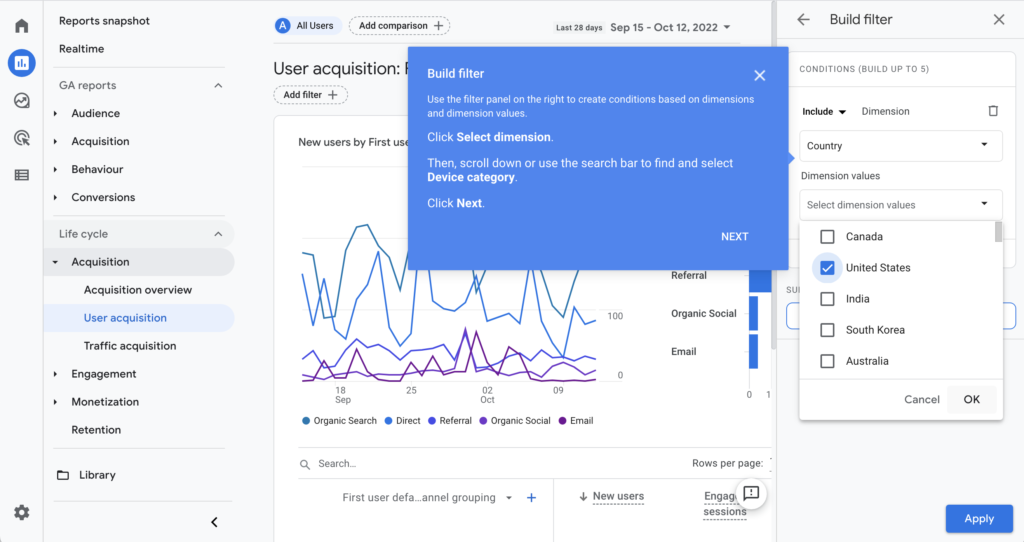
GA4 prompts demo how to set up a filter to see only Desktop traffic vs. Mobile or Tablet. But we can use the same prompts to filter for Country = United States.
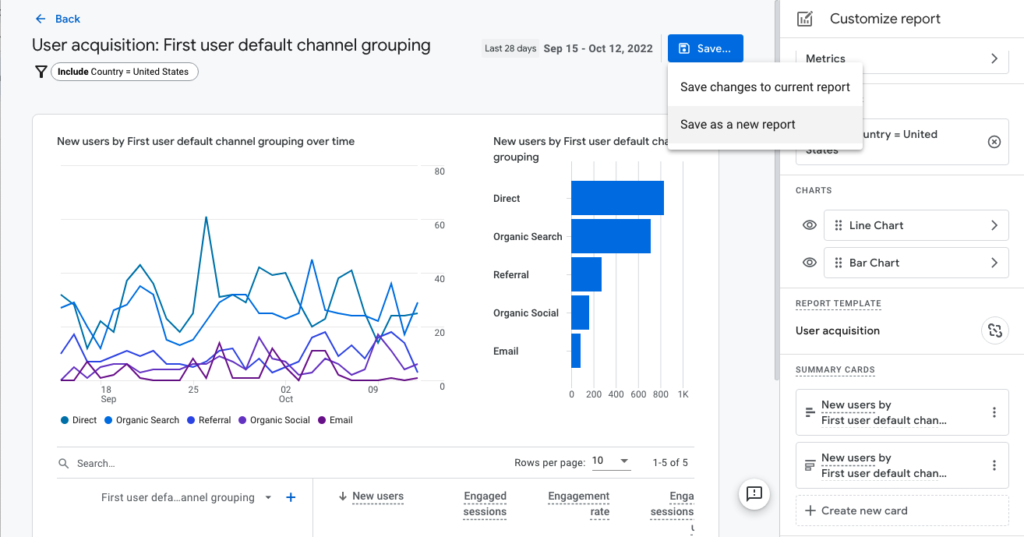
To create a report that we can save and easily view again, we need to follow the same process but in a different section of GA4.
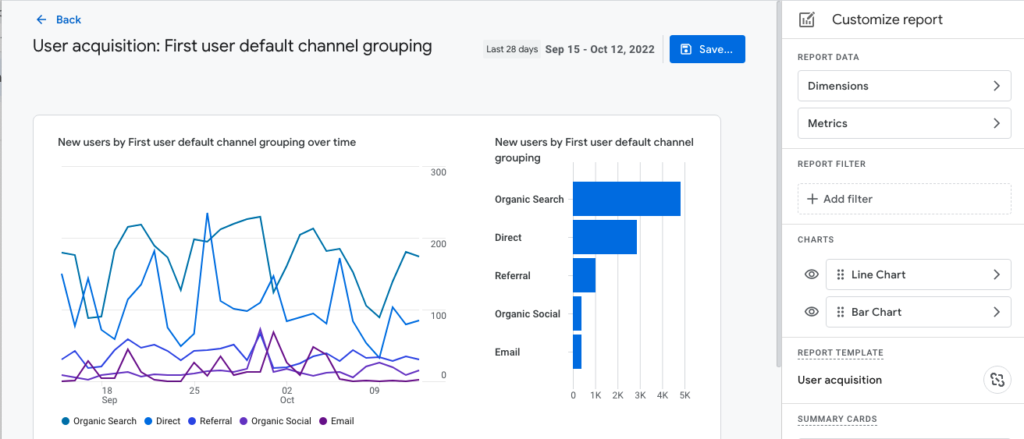
How to customize and save reports into a Collection in the Library section of GA4
You can build an entire report collection, pre-filtered to just certain traffic, by using the customize report function and then saving and renaming the filtered report.
How to create a USA – user acquisition report
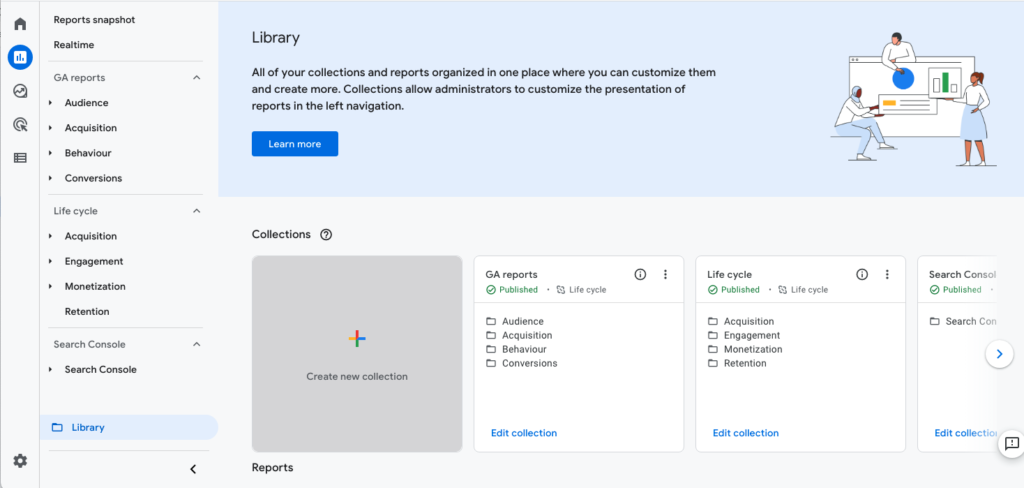
You can customize and save each of your most used reports and add those reports to a collection. In this example, you would select “Blank,” give the collection a name (eg. USA View), and then select the USA-filtered reports that you want to add to the collection.
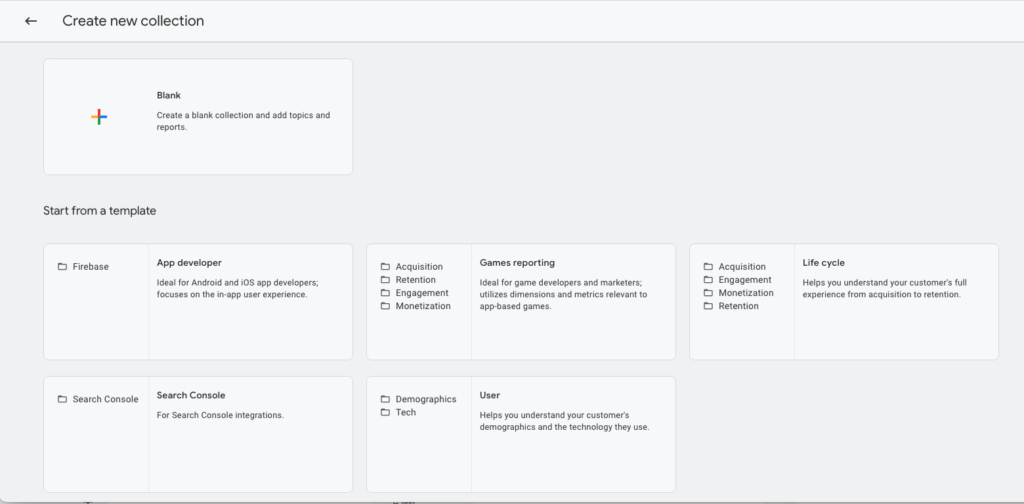
Alternatively, you can duplicate an existing collection, like the Life cycle collection. That will duplicate all the reports in the Life cycle collection, which you can then rename “USA – Life cycle”. Next you will customize each duplicated report by adding the Country filter. Remember in this case to “Save changes to current report.”