GA4 includes a powerful analysis tool called Explore. It’s a set of advanced features that lets users build custom reports, which is required if you want to go beyond the rather basic reports in the Reports section.
Here’s an example scenario: Your ecommerce website includes detail pages with product descriptions and links to other retail sites where people can buy your stuff. The standard report in GA4 shows how many times outbound links were clicked, but not what URL was clicked nor what page people were on when they clicked the link. Your site has a blog and other resources pages with links to event listings and your social media profiles. How do you find out which links were clicked, how many times, and from what pages? Maybe you want to know how many times people click to buy a particular item from an independent retailer vs. Amazon?
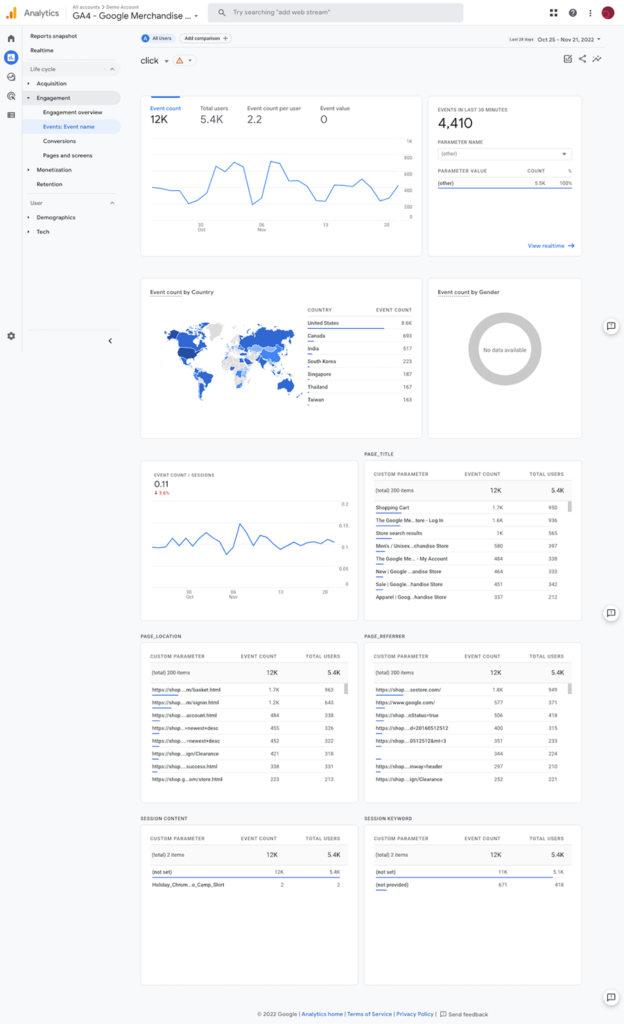
Here’s the standard report:

The standard report shows total number of times an outbound link was clicked. But none of the widgets show us a table with each link and the number of times it was clicked.
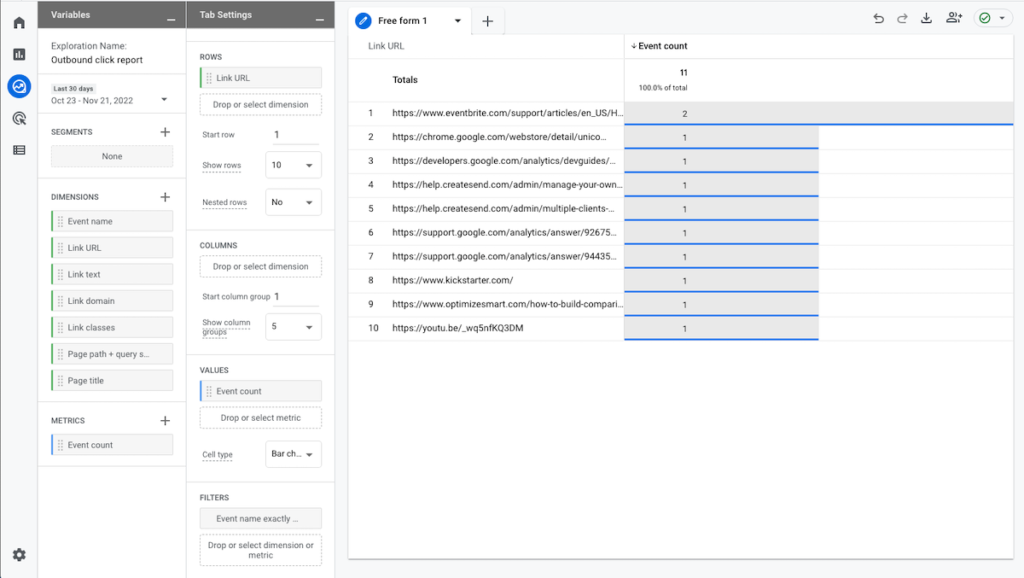
Here’s what an Outbound Click Report looks like in Explore:

How to create an Outbound Clicks report
- In GA4, go to Explore.
- Select Blank
- Set the timeframe to the last 30 days
- Import dimensions for Event Name, Link URL
- Import metrics for Event Count
- Populate the Row with Link URL
- Populate the Column with Event Count
- Filter by Event Name exactly matches “click”
Watch the video below for a demo.
The Explore report is an example of a Free Form report. “Free Form” means that the output (the report we generate) is a table based on the variables and tab settings we selected. We started with a Blank report then added variables.
The Variables section is where we decide on the data we want in the report. Above we picked:
- Date range
- Dimensions
- Metrics
Dimensions are attributes that describe something. In our case:
- Event name (we import event name so we can filter for event name matches “clicks”)
- Link URL
- Page path
Metrics are what we measure. We selected:
- Event count
The Tab settings is where we configure what the report will look like:
- Table
- Donut chart
- Line chart
- Scatterplot
- Bar chart
- Geo map
Rows is where we usually put Dimensions.
Values is where we put the Metrics so that they appear in the columns of our table.
Filters is where we narrow down the scope of the report. For example, include only “click” events.
Other ways to use Explore reports
You could follow the above steps to create a File downloads report, or Form Completion report. You would just filter by that event name instead of “clicks”.
Similar steps can be followed to create a Landing page report. BUT as of Dec 2022 Google introduced a Landing Page report, learn more about the Landing Page report here.
Explore can be tricky so a great place to start is by reviewing your favourite Universal Analytics reports and noting what dimensions and metrics are in the rows and columns. Then practice by rebuilding those reports using GA4 Explorations.


