In Universal Analytics (UA), I was fond of the various behaviour reports. I used the All pages, Landing pages, and Exit pages reports for understanding what was happening once visitors arrived to the website. I also used the Site Speed report since load speed has an impact on overall site performance.
The GA4 engagement reports tell a different story about how people engage with the site content. Even the metrics are different. For example, in GA4 there is no Bounce Rate (it may be reinstated). Instead we have the awesome Engaged Sessions metric. I think this is a superior way to measure engagement with site content. In UA, a person “bounced” if they came to a webpage, read the full page, interacted with some pop-up like “add to wishlist” and then left the site. That sounds like engagement to me, but in UA, it would be a bounce, which suggests limited interest in the content. In contrast that same scenario in GA4 is considered an engaged session because the user was active on the page.
An Engaged Session is typically 10 seconds or more, or had 1 or more conversion events or 2 or more pageviews. You can extend the time from the default 10 seconds to up to 60 seconds but I think 10s is a good benchmark.
The GA4 Engagement reports also include the Events report and Conversion report.
Remember that events are different in GA4 vs. UA. In UA, events were defined in the Admin section and were manually set up to track interactions like file download, button clicks, and form submissions. In GA4, any interaction with the site is an event and many of these events are automatically tracked:
- click
- first_view
- page_view
- session_start
- scroll
- user_engagement
- view_search_results
In addition, ecommerce and other events can be added. For example view_item, add_to_cart, and purchase.
In GA4, any event can be toggled on as a conversion in the Configure section.
GA4 – Using the Engagement Pages and screens report
The GA4 Pages and Screens report that is most similar to the Universal Analytics All Pages report. This is a standard report. But to see Landing Pages we need to manually create an exploration report.
Let’s start with the Pages and Screens report.
Step by Step
Go to Reports, then Engagement, and then Pages and screens.
This report shows all pages, sorted by the total number of views (or pageviews) for each page.
The default presentation shows page title, and you can change this by selecting the drop down and choosing a different dimension. Page path, for example, will show you pages by URL instead of by title.
Scrolling to the right, we can see additional metrics for each page:
- number of users
- number of new users
We can see some engagement metrics:
- average number of pageviews per user (this metric will increase as people view the page multiple times)
- average amount of time people spend viewing a page
- number of times people have scrolled each page
Last we can see the total number of events that have been occurred on each page. This includes the events automatically collected by the enhanced measurement feature and any other events you have implemented.
Instead of seeing the count for all events, you can show a specific event by selecting it from the dropdown. For example, GA4 automatically tracks outbound link clicks. We can select the “click” event to see the number of times visitors clicked an outbound link on each page.
The report also shows the number of conversion events that have been collected on each page and any revenue that is associated with each page. If you haven’t configured conversions in GA4 then you can track events as conversions in the Configure section.
The standard Pages and Screens report provides a lot of information about overall pageviews for all pages but this isn’t the same as the number of people landing on each of the pages. To understand the first page people see when they land on your website, you need to create an exploration report.
Using Explore to create a Landing Pages report
GA4 does not have a standard report for Landing Pages or Exit Pages but we can create this using Explore.
UPDATE Dec 2022: Google has introduced a new Landing Page report. You can ignore the below. Here’s more about the report. https://support.google.com/analytics/answer/12931766
UPDATE Oct 2022: Google has introduced an easier way to create a Landing Page report in Explore. Instead of page_url in the rows, import the dimension “landing page”. Then you do not need to add later steps to filter the traffic. Since the steps are useful for other types of reports, I’ll leave the video and instructions below as is.
Step by Step
Go to Explore and create a blank report.
Name the report Landing Pages.
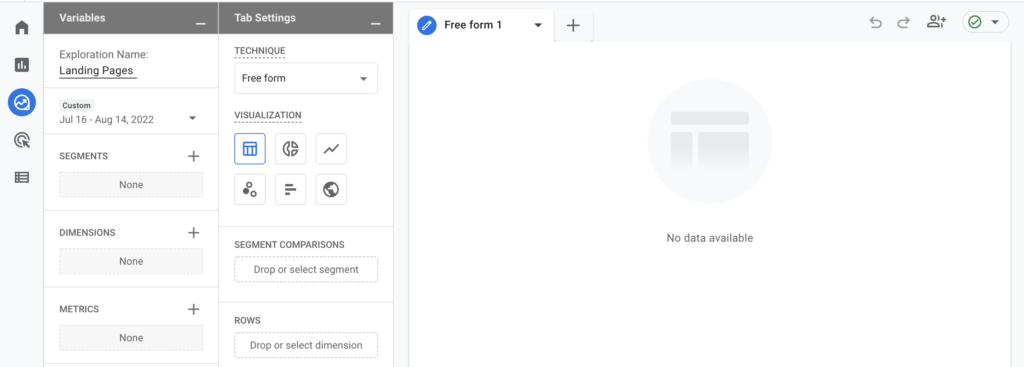
Now we need to enable the dimensions and metrics we want to use in our report.
Click the plus sign next to dimensions. Search for “page.”
UPDATE Oct 2022: You can now select the dimension “landing page”. For metrics, choose sessions, engaged sessions, total users, new users, engagement rate, average engagement time per session, conversions, total revenue.
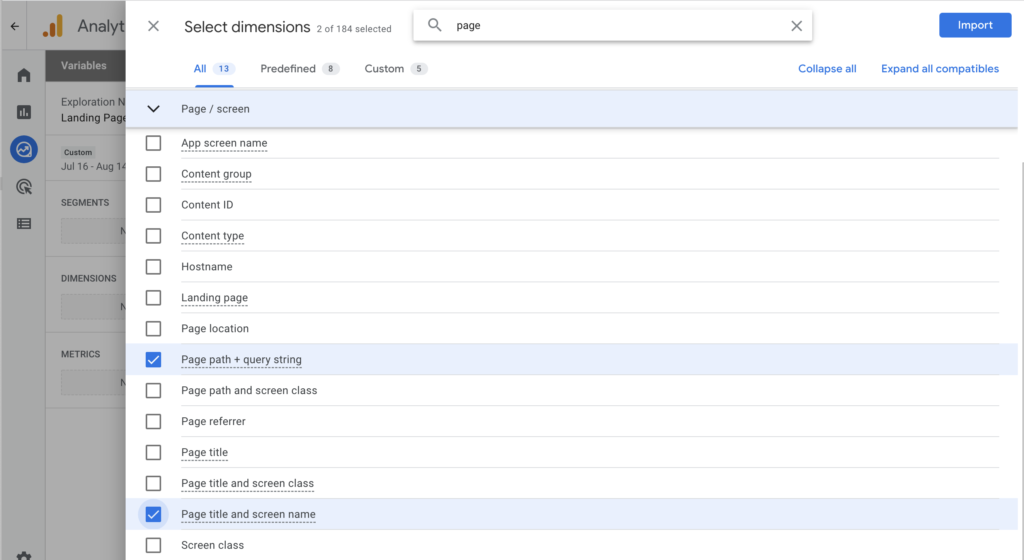
Under the Page / screen section we can see different dimensions that we can add to our report:
- Page location dimension will show the full URL of the pages people view. This will include the domain of your website, the page and any query parameters.
- Page path + query string will show the path along with any query parameters. So everything after the domain of your website
- Page path and screen class will show the path but without any query parameters
- Page title and screen name will show the title of the page like we saw in the standard report.
I prefer to select Page path + query string because this works best for many of my client sites. You may prefer Page path + query string. Or pick all of them and try it out in the report. At this stage we are identifying dimensions we want to import for use in the report.
Click Import.
Next click the plus sign next to metrics. And search for page. This will show the metrics relevant to Page / screen.
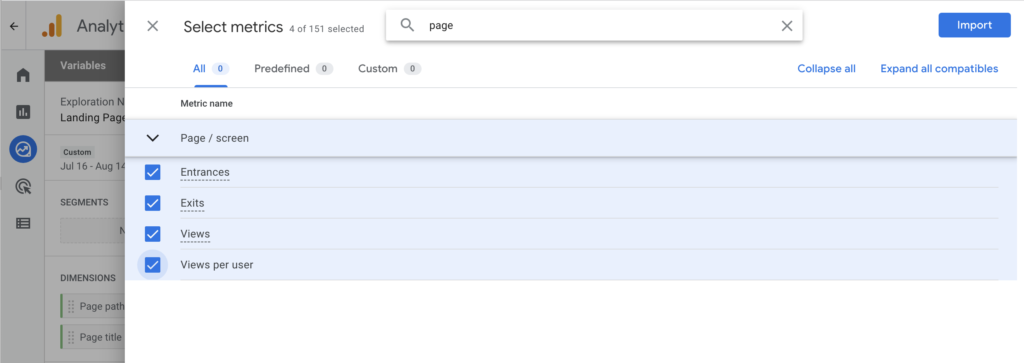
If you’re ever unsure about a metric, just hover over the name of the metric to see the definition. The Entrances metric will show the number of times that a session started on a particular page (aka the landing page, or first page of a session).
Also select Views (the number of page views) and Views per user (we saw this metric in the default pages report). If you want to run an Exit Page report them import Exits as well.
Click Import.
You can add whatever additional metrics make sense for your report by clicking the plus sign beside Metrics. For example, I recommend adding Engagement Rate, which is a better way to measure interaction than bounce rate, as mentioned in the intro.
Your screen should look like something like this.
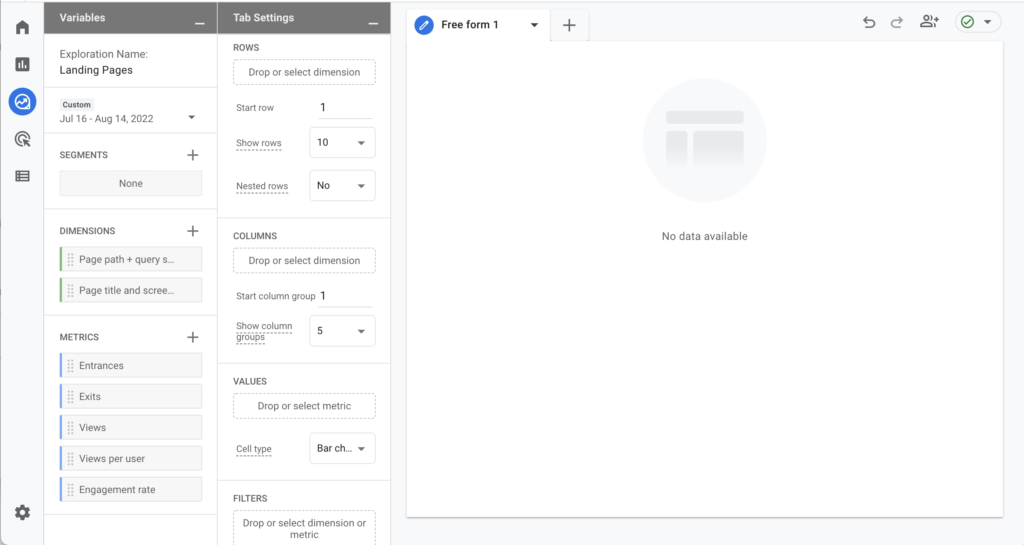
Now that the dimensions and metrics are available on the left, we can add them to the report by dragging Page path + query string off dimension and placing it under rows and then dragging the various metrics under values.
Tip: You can also double click on each dimension and metric to do the same thing.
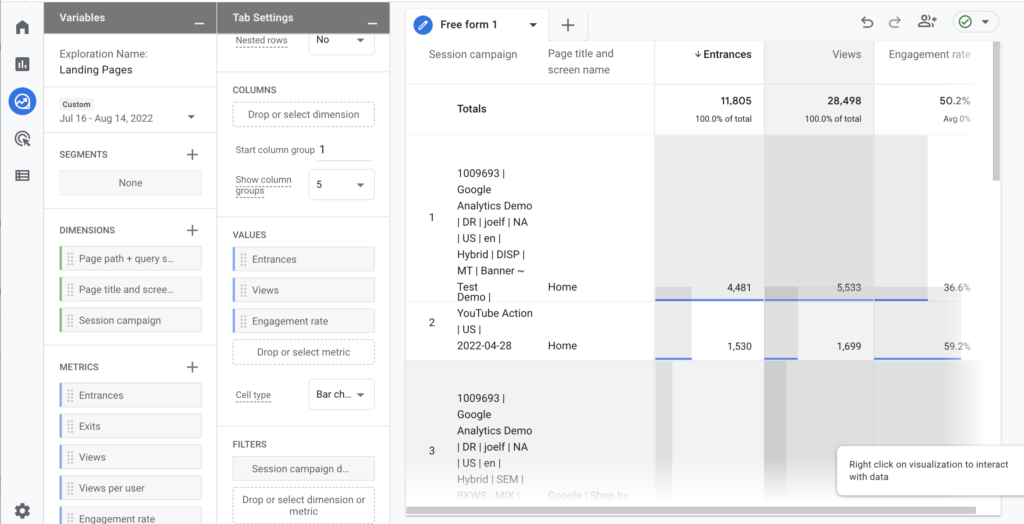
Now we have the top landing pages report for our website based on the number of entrances at each page.
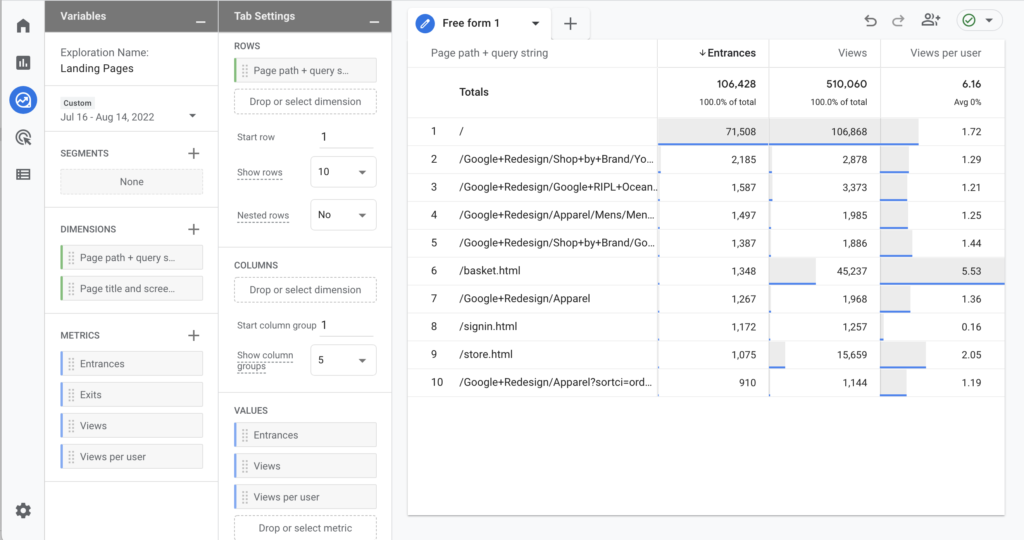
Using Exit Pages
If you used Universal Analytics’s Exit report then you can swap out the metric “Entrances” for “Exits” to modify the report to show top exit pages vs. landing pages.
UPDATE Oct 2022: The above instructions create a report that is similar to the All Pages report or Exit Pages report in Universal Analytics. For a Pages report, the key metrics are views, entrances, exits, and engagement rate. With a landing page report, the key metrics are related to users and sessions so the dimension is “landing page” and the key metrics are sessions, engaged sessions, total users, new users, engagement rate, average engagement time per session, conversions, total revenue.
Campaigns report
If you frequently used Universal Analytics Campaign report then you can take this exploration report a step further and modify it to show the campaigns that are sending people to the website along with the landing pages.
You do this by clicking the plus sign next to dimensions again, and then searching for Session Campaign.
Now drag this dimension under rows, and above Pages.
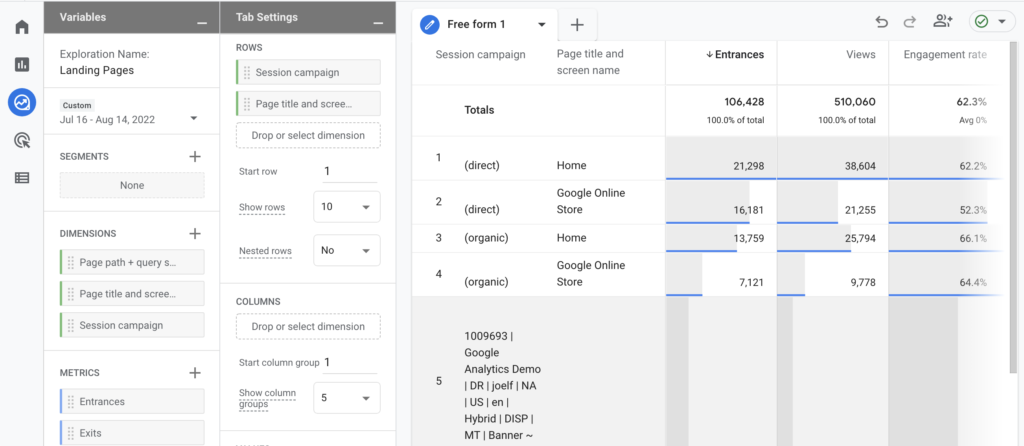
Initially the report includes traffic that is not from campaigns, like traffic from organic, direct and referral.
To remove these from the report, scroll to the bottom of the second column:
- Click add a filter
- Select the session campaign
- Choose does not match regex
- Enter \(.*\)
- Click Apply
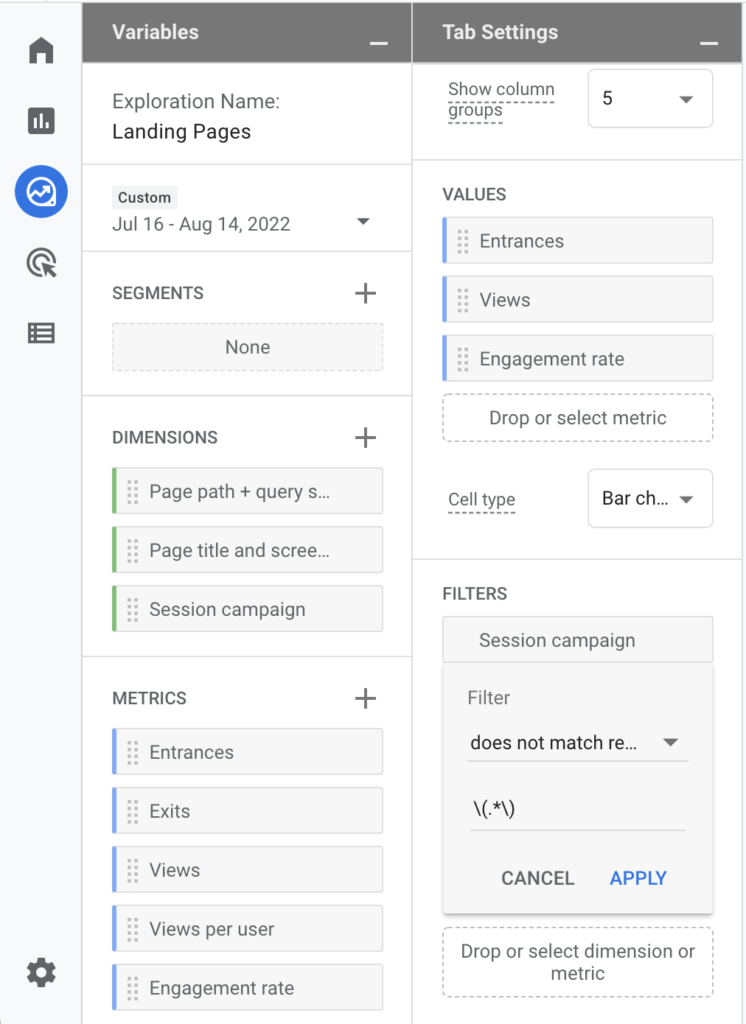
Backslash, open parenthesis, period, asterisk, backslash, close parenthesis will match any campaign that contain an opening and closing parenthesis with something in between.
Now the report is modified to focus on campaign traffic and to top pages.
